HUGIn is designed to explore chromatin organizations across multiple human cell lines and primary tissues. HUGIn incorporates data from multiple sources including genetic variants (SNPs), chromatin organization features (including topologically associating domain (TAD) boundaries, frequently interacting regions (FIRE)s, and long-range chromatin interactions from the analysis of Hi-C data) gene expression (from tissue or cell line specific RNA-Seq data), and multiple epigenetic datasets (including information on typical and super enhancers, CTCF binding sites, H3K4me1, H3K4me3, H3K27ac, H3K36me3, H3K27me3 and H3K9me3 peaks). Current data are all mapped to the reference genome hg19 (Genome Reference Consortium GRCh37). For more details and a complete tutorial, please see our Tutorial page.
See data description here.
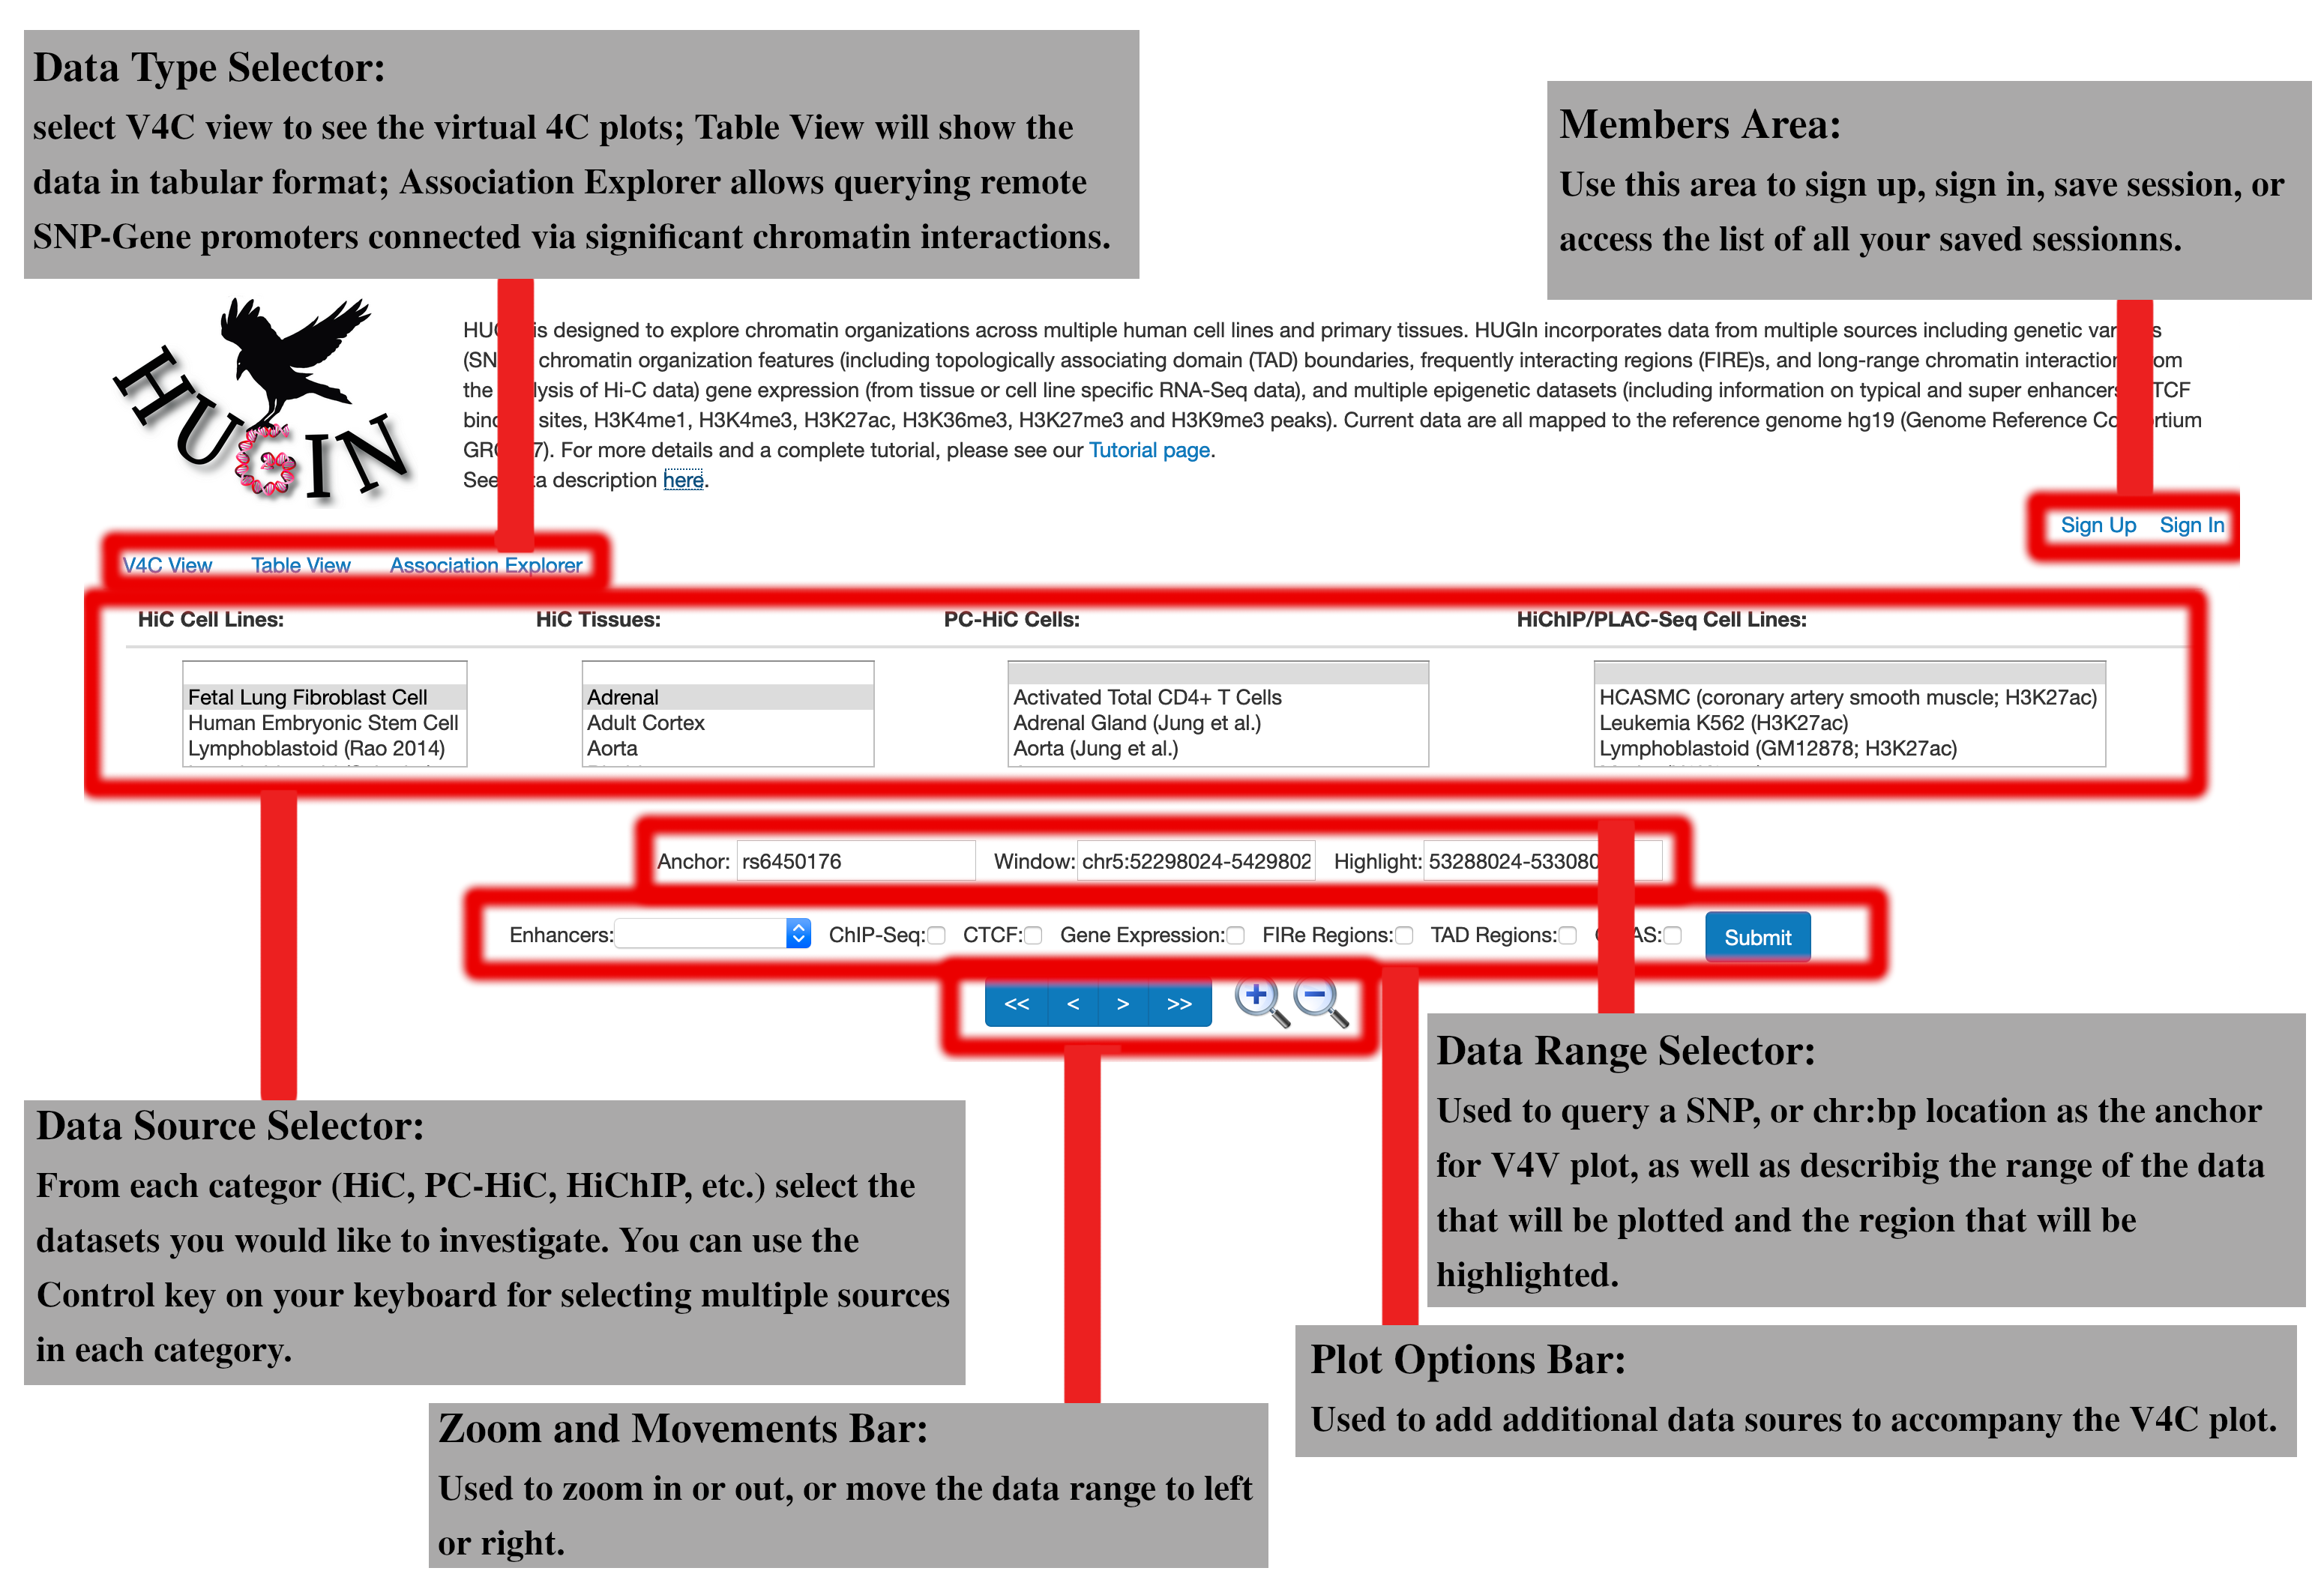
User Interface
HUGIn hosts a compendium of chromatin data mapped to the human reference genome hg19. The main interface of HUGIn consists of the following six major sections:Data Type Selector:
The first section is the “Data Type Selector” tab. The first option here is the V4C plot, used for generating virtual 4C plot given an anchor position. You might want to see these data in a tabular format for further investigation, in this case you can use the second tab: "Table View". The third and final option is "Association Explorer". Association Explores allows the user to input a list of SNPs to find the remote genes with promoter interacting with the SNP region, or vice versa, insert a list of genes to extract the SNPs in areas interacting with the genes.Members area:
This panel is used to register a membership on HUGIn in order to make use of the additional capabilities provided to the members. Members are allowed to save their V4C and Table view sessions. These stored sessions will be held on our database for 30 days after the last time they access the session. Members can also renew these sessions or delete them, through the members portal which can be accessed from the same area, once they have registered. Stored sessions can be shared with collaborators without requiring them to have an account. After saving a session, you will receive a notification including the link to the stored session, you can use this link for access later or for sharing your session. You do not need to worry about remembering these links, as all your stored sessions and their corresponding links can be accessed through the members portal. Simply, click on your username in the "Members Area" panel after signing in.Data Source Selector:
This area lists all the chromatin interaction datasets that we have accumulated in HUGIn database. The datasets are separated by their sequencing technology and data type (HiC cell lines, HiC tissues, Promoter Capture HiC, PLAC-Se and HiChIP). Each of these lists is sorted alphabetically. If you want to select multiple datasets from a category, you can hold down the Control key on your keyboard while clicking on the dataset names. If you want to select a range of datasets from a category, you can also use the shift key, to specify the beginning and end of the range. If you would like to not show any of the datasets from a specific category, you can select the first option from that category (an empty selection). A list of all the available datasets and their source publication can be found in the data description link provided at the top of all HUGIn pages.